Computers


I made a successful upgrade to Snow Leopard recently on my Macbook Pro, and while 99% of it was positive, there are some strange things which just “don’t work” anymore.

One example is the ability to browse Windows shares and shared printers on windows computers. This worked fine on Leopard, but is no longer working with SL.

In looking around I found a work around which, while not elegant, kind of makes sense and I’ll use for now. Basically what was happening was that SL can see the Samba share, but can’t resolve the IP address. So by adding in the computer name and IP address to /etc/hosts you can fix the problem.

For example:
192.168.1.x hostname

Hint taken from MacWindows.com

So out of the blue the display stopped working on my 15″ Macbook Pro. The computer would come out of sleep, but no display, nothing. Total blackness. I was also unable to get anything on the external display as well. After a bit of research everyone seemed to agree (from what I’d read) that it was the logic board, and that since it was out of warranty it would cost a pretty penny. I decided to try my luck and give Apple Care a call. To their credit, they at least talked to me even though I was out of warranty. Their “fix” was for me to go into the nearest Apple store and get service there. I was also quoted at $1100 for a new display. Now, I also explained the entire situation (computer is on, can get to it in target mode, just no displays), and he felt it was a motherboard problem. That made no sense to me.

I gave up for a bit to get some work done, and then late in the evening I decided to look on the net one more time. Lo and behold something interesting appeared. Evidently this nVidia thing where you get a black screen after waking up from sleep is common. So common that they are reimbursing any repairs that involved the nVidia cards on these MacBooks.  

So I printed that out and took it with me to the “Genius” bar. It must be common because they had a special device to check for the nVidia failure. And there it was… So the repair is free, but I’m out the laptop for 10 days+. The plus being related to something strange. We were all finished when the “genius” asked me for my username and password “So they can do tests and stuff”. Well, there was no way that I was giving my username and password out, and that was pretty much the only admin account on there. Since I had just made a backup with Super Duper I had them wipe the drive, but I thought the whole thing was bizarre. Can’t they do the tests from a disk in single user mode?

At any rate, I’m happy that it’s a free repair, but confused why the Apple Care guy didn’t at least acknowledge that this could be the problem, and why they needed my username and password. 

Well, it’s good to purge once in a while I suppose…

I had been having trouble upgrading to the latest ipython (0.9.1) through macports. In fact, at this point I can’t even access the site, so I’m not sure what’s up. At any rate, the upgrade would fail only because the file ipython-0.9.1.tar.gz couldn’t be downloaded (well, I guess the source file is somewhat important!). So to get it to work I kind of had to brute force it by manually downloading the file (I googled it) and putting it in /opt/local/var/macports/distfiles/python.

Then I ran:

sudo port upgrade py25-ipython

and it went just fine.

At this point just a small update to say that since the activation fiasco, I have not used Matlab at all. Everything that I have done for the last four presentations has been done with R and Python, and I am both the happier and wiser for it.

I have been playing with JMP a bit, but honestly, it’s a bit too “high level” and while it’s neat for data exploration, it really made me nuts that two weeks after I got a license, they were *offering* me a special deal on the impending upgrade. Nothing like dropping a bundle on instantly outdated software. Way to go guys.

So for me, it’s been a pleasure to use R, Python (with iPython of course), and ferret on my Mac Pro. If I ever take a break from playing on the computer I’ll post up what I installed on the new Mac in terms of scientific software.

I’ts been a while since I posted something, but that’s just because I’ve been swamped at work. One of the main reason that I even post here is so that I can remember how I did something later on down the line. Here’s a perfect example. A while back I wanted to make a quarterly average of a 2d time series (i.e. average a 2d field every three months). You can make climatologies in ferret, but here I wanted a subset to average over, not the entire time range. One thing that seems to work here is to just do a 3 month average from the middle month that you want in the range. An example below is to make a three month average of a SeaWiFS chlorophyll-a field for October – December 1997:

let swseas = CHLA[l=3:200:3@AVE]

This starts at month 3 in the time series (Nov 1997 in SeaWiFS) and goes to the end of the series (yes 200 is too many but it’s OK) and then averages every three months.

It almost seems to make more sense to start at October and go forward every three months, but that doesn’t work as it must average on the center node…

START AT OCTOBER:

yes? list CHLA[x=190,y=35,l=2:4]
VARIABLE : Chlorophyll-a Concentration (Milligrams per cubic meter)
FILENAME : chla-SeaWiFS_Monthly_Chla
FILEPATH : las-FDS/LAS/SeaWiFS_Monthly_Chla/
SUBSET : 3 points (TIME)
LONGITUDE: 170W
LATITUDE : 35N
170W
1901
18-OCT-1997 / 2: 0.1265
17-NOV-1997 / 3: 0.1700
18-DEC-1997 / 4: 0.2466

Average is 0.181033

AVERAGING STARTING AT MONTH=2 (OCTOBER) = WRONG
yes? list CHLA[x=190,y=35,l=2:4:3@AVE]
VARIABLE : Chlorophyll-a Concentration (Milligrams per cubic meter)
regrid: 2192 hour on T@AVE
FILENAME : chla-SeaWiFS_Monthly_Chla
FILEPATH : las-FDS/LAS/SeaWiFS_Monthly_Chla/
LONGITUDE: 170W
LATITUDE : 35N
TIME : 18-OCT-1997 06:30
0.1283

AVERAGING STARTING AT MONTH=3 (NOVEMBER) = CORRECT
yes? list CHLA[x=190,y=35,l=3:5:3@AVE]
VARIABLE : Chlorophyll-a Concentration (Milligrams per cubic meter)
regrid: 2192 hour on T@AVE
FILENAME : chla-SeaWiFS_Monthly_Chla
FILEPATH : las-FDS/LAS/SeaWiFS_Monthly_Chla/
LONGITUDE: 170W
LATITUDE : 35N
TIME : 17-NOV-1997 17:00
0.1810

Well,

I broke down and jailbroke my phone last night. Partially it was just to try it, but also because I was getting sick of the subpar 3rd party apps that were inundating the App Store. After following the instructions via Lifehacker to install Cydia, I was able to install OpenSSH as well as other cool things, like Python.

Then I saw that you could install iPython on the iPhone so I thought, let’s try it.

So hard was it? With the python package installed it was

easy_install ipython

Seriously.

To lay it out in terms of steps…

1. Install Cydia (The only caveat here is that I got a different SHASUM when I checked the pwnage tool from the macgeekblog site, I then redownloaded from the pwnage mirrors)
2. Follow the instructions to get openSSH up and running.
3. Go into Cydia and under “sections” got to “scripting”. There they have Python (among others).
4. I also installed a terminal
5. Now you can either go in through the terminal on the iPhone(touch) or SSH in from a differnet computer. Either way, su to root and then you can
6. easy_install ipython

Next of course would be to install Numpy and do folding at home (I’m kidding!), but this just shows some serious possibilities.

Did I also mention that I installed the NES frontend which can use all the public domain ROMs that are out there? Someone mentioned ROM world and The Old Computer but I haven’t checked them out yet.

Cool stuff.

Blogged with the Flock Browser

Tags:

A coworker recently approached me if asked if I knew how to make Pie Wedge plots in the Generic Mapping tools using the -Sw(w) switch. I had never done this before, but I thought it would be a cool thing to do so I tried my hand a making one.

It was tougher than I thought, and while I have seen these types of plots quite a bit in the fisheries world, there didn’t seem to be any examples of how to do this. So I thought I would post up here what I did, both for myself in the future and for anyone else in the world who may be interested in this type of plot.

Basically what I want to do is to make a dummy plot with a pie chart centered at every 5×5 degree box with a different size outer circle based on the total number in the box, and wedges representing percentages of that total amount.

For this exercise I am using the PXSY routine of GMT4.2.0 with my default MEASURE_UNIT = in.

To make this chart you have to have 5 columns of data:

Longitude — Latitude — Radius — StartAngle — EndAngle

So say I want a pie chart to represent how many types of widgets I sold in the area from 160-155W, 18-23N, with each wedge a portion of the widgets and centered in the middle of the 5×5 box. Here’s the data:

#lon lat blueWidget greenWidget redWidget
-157.5 20.5 200 200 400

So let’s say I make a map where each inch = 1 degree. The largest that I want my pie wedge diameter is 1 inch, so I know that for this example (only one data point) I will make the radius 0.5. I also know that the total for this example point is 800, so I convert this into angles. I actually have to make 3 rows of data now since I have three widgets. I also converted to 0-360 degrees.

$>cat pienc.xy
#lon lat radius startAngle endAngle
202.5 20.5 0.5 0 90 #end angle is 360 * (200/800)
202.5 20.5 0.5 90 180 #start angle is row-1 end angle
202.5 20.5 0.5 180 360 #Finish circle

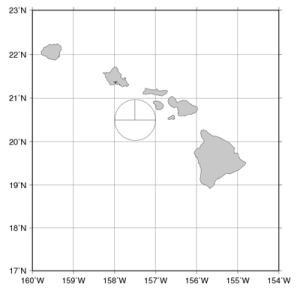
So, a nice shell script to plot this up with the output below:

$>cat pienc
#!/bin/ksh
psfile=pie.ps
psbasemap -Jm1 -R200/206/17/23 -Bf1a1g1/f1a1g1WeSn -X1.5 -Y4 -P -K > $psfile
pscoast -Jm -R -O -K -Di -G200/200/200 -W1/0/0/0 >> $psfile
psxy pienc.xy -Sw -Jm -R -O -K >> $psfile
echo “203 24 12 0 0 6 Pie Chart Example” | pstext -Jm -R -O -N >> $psfile

$>display pie.ps

Pie Wedge Plot no Color

Pie Wedge Plot no Color

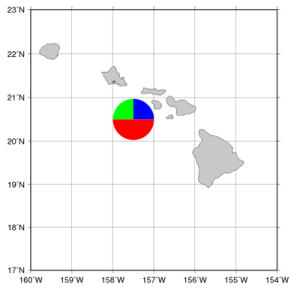
So that’s all well and good, except it would be nice to have different colors for each wedge representing a different widget. To get color in there you have to give a new column of values that will be mapped to a color value in a color lookup table (a cptfile in GMT). This column must be in the third row and then the -C switch must be given in the psxy call.

$>cat pie.xy
#lon lat COLORVALUE radius startAngle endAngle
202.5 20.5 1 0.5 0 90 #end angle is 360 * (200/800)
202.5 20.5 2 0.5 90 180 #start angle is row-1 end angle
202.5 20.5 3 0.5 180 360 #Finish circle

And my cptfile:

$>cat pie.cpt
0 0 0 255   1.1 0 0 255
1.1 0 255 0   2.1 0 255 0
2.1 255 0 0   3.1 255 0 0

The adjusted script:

$>cat pie
#!/bin/ksh
psfile=pie.ps
psbasemap -Jm1 -R200/206/17/23 -Bf1a1g1/f1a1g1WeSn -X1.5 -Y4 -P -K > $psfile
pscoast -Jm -R -O -K -Di -G200/200/200 -W1/0/0/0 >> $psfile
psxy pie.xy -Sw -Jm -R -O -K -Cpie.cpt >> $psfile
echo “203 24 12 0 0 6 Pie Chart Example with Color” | pstext -Jm -R -O -N >> $psfile

$>display pie.ps

PIe Wedge plot with color

Pie Wedge plot with color

And that’s pretty much it. Now to go sell some more widgets.

A funny thing happened on the way to forum. I fired up my virtual XP machine yesterday for the first time in a while, and I was prompted to upgrade to build 5608. OK. No problem. So I hit update, downloaded the 88 MB dmg package and waited for it to upgrade. Nothing. Bupkiss. Actually, Parallels just hung, bad. I had to force quit it and try to open the dmg package. No dice, the file was corrupt. I seemed to remember this happening the last time that I went for an automatic updare so I manually downloaded 5608, opened the dmg package and installed the update.

Then the fun began. Not only did Parallels hang when I tried to start the virtual machine, I got the grey screen of death! “YOU MUST REBOOT YOUR COMPUTER NOW!” Crap.

Well, looking up the problem in the “Knowledge base” I found that “Errors occur when you try to install or update Parallels Desktop, create or open virtual machines, load the required drivers to the guest OS” The handy solution? Reboot. Repair disk permissions. Reinstall. Why? Because evidently “Working in Mac OS for long periods of time without restart may lead to some minor glitches to appear in the system as a whole.”

Yup, feels like XP!

Blogged with the Flock Browser

OK, another night, another trial. I must say, tonight was a lot more fun than the last couple of nights, because I really felt that I learned something, which is really the whole point of this exercise. So the example I was trying to code tonight is a simple EOF of a 3D data series. This is something that I just had to code up at work today, so it was a perfect chance for me to try out Sage. For work I ended up altering an existing m-file and running the EOFs in Matlab, but that’s OK, because now I know what I expect to see after running this in Sage.
The data names have been changed to protect the innocent.

# Load in required modules
sage: from scipy.io.netcdf import *
sage: from pylab import *
sage: from scipy.stats.stats import nanmean
sage: import datetime

#Load data from NetCDF file
sage: ncfile = netcdf_file('file.nc','r')
sage: varnames = ncfile.variables.keys()
sage: varnames

['LONGITUDE', 'TIME', 'LATITUDE', 'DATA']

#Now that I have the order I can load into arrays
sage: lon = ncfile.variables[varnames[0]][:]
sage: lat = ncfile.variables[varnames[2]][:]
sage: dates = ncfile.variables[varnames[1]][:]
sage: raw = ncfile.variables[varnames[3]][:,0:50,:] #I only want 50 records in Y
sage: data = raw.copy() #make a copy
sage: data.shape
(124, 50, 151)
sage: (ncycles, ny, nx) = data.shape

#deal with dates
sage: ncfile.variables[varnames[1]].attributes

{'axis': 'TIME',
'time_origin': '15-JAN-1901 00:00:00',
'units': 'HOURS since 1901-01-15 00:00:00'}

sage: off = datetime.datetime(1901,1,15,0,0,0)
sage: months = ones(ncycles)

sage: for i in range(0,ncycles):
....tdel = datetime.timedelta(days=dates[i]/24)
....td = off + tdel
....months[i] = td.month

sage: ind = where(raw<0)
sage: data[ind] = nan

And here was the first real bottleneck, as things just slowed to a crawl as python tried to find all the instances where the data was less than zero. This is something that is instantaneous in Matlab, and took over 30 seconds to go through 124*50*151 values. There must be a faster way to do this.

data2=data.copy()
#Take out monthly averages
sage: mclim = ones((50,151))
sage: for i in range(1,13):
....index = where(months==i)[0]
....mclim = nanmean(data[index,:,:])
....data2[index,:,:] = data[index,:,:] - mclim

data2.shape = (ncycles, nx*ny)
ltmean = nanmean(data2) #get mean of each time series

#take out long term mean
sage: anom = data2.copy()
sage: for i in range(0,ncycles):
....anom[i,:] = data2[i,:] - ltmean

sage: EOF = nan_to_num(anom) #push land back to zero
sage: [u,s,v] = linalg.svd(EOF)
sage: for i in range(0,ncycles):#build array so that we can project eigenvalues back onto timeseries
....s2[i,i] = s[i]
sage: amp = dot(s2.transpose(),u.transpose()) #get amplitude
sage: spatial = v[0:4,:]# pull out spatial fields
sage: ratios = pow(s,2)/sum(pow(s,2))*100 #get %variance explained for each mode
sage: temp = spatial[0,:]
sage: temp.shape = (ny,nx) #push back to original dims
sage: plot(amp)
sage: savefig('amplitude.png')
sage: imshow(flipud(temp))
sage: savefig('spatial.png')

Success!

I actually really felt positive about this whole example as I really learned a lot more. This also was probably too large of an array to test out (measure twice cut once!) but it’s what I was working with so I wanted a real world example. The more that I worked in sage the more comfortable I felt as well. The geographic projection issue is still there, as well as some indexing speed issues, but overall, I was really impressed with the Sage/SciPy/NumPy experience today. Overall I feel that more of a transition was made for me last night/today. Which was great timing as a co-worker actually called me and asked if I knew of any free replacements for Matlab…

Technorati Tags:
, , , , , ,

This was quite possibly the worst idea for title naming that I could have thought of. Anyway, I played around a bit more tonight, and I thought that I would give an update to the three people that are waiting with bated breath.

Anywho, I decided to continue trying to map the data from the netcdf file onto a projection, and here’s what I ran into.

It looks like the basemap module is installed (as basemap) but that it depends on matplotlib > 0.98 and 0.91 is installed. I tried to be tricky and move my locally installed matplotlib over to the sage/local/lib/python2.5/site-packages directory but then that version of matplotlib needed a newer version of numpy than what was installed. At this point I tried

hostname $> sage -upgrade

to see if updated packages/modules were available. This started a huge chain reaction of downloads and source compiling to get to the latest, greatest versions. This process took exactly 59m10.482s to complete (I know because it told me!).

But once again, I get this error:

sage: from basemap import basemap

ImportError: your matplotlib is too old – basemap requires version 0.98 or higher, you have version 0.91.1

At this point though, it’s not working on either the linux or OSX platforms due to outdated dependencies, so either I need to find another way to plot mapped projections or use something else.

Again, this isn’t a knock against Sage, because I really don’t think that is an ideal test for this software. But honestly, a lot of why I went for this approach was to avoid having to use separate approaches for data manipulation and visualization, and this would be a common task. Matlab’s mapping toolbox is useless to me for plotting, so I end up using m_map, which is still not as good as GMT, but it gets the job done in house.

My main thoughts at this point are that it seems easy to get into dependency hell here, as one module upgrade can force another, and so on. At this point it’s another block of time spent on setup, and no result. Time to stop for the time being.

Technorati Tags:
, , , , , , ,

Next Page »